
Nike (NYSE: NKE) and Adidas (ETR: ADS) are the two most recognizable sports brands in the world. Their battle for supremacy has defined the modern era and looks set to continue for the next decade and more. While competitors such as Puma, Under Armor and New Balance are well established and growing, they have failed to break up this duopoly.

From a financial perspective, Nike is much larger than Adidas but, in recent years, Adidas has accelerated its growth.
Which stock should you buy and hold for the long term?
In order to answer this question, an exhaustive comparative analysis is necessary. I will analyze the following aspects of both companies:
- Franchise strength
- Total Revenues and growth rate
- Margins and profitability
- Assets and liabilities
- Cash flow
- Dividend
- Stock performance
1 – FRANCHISE STRENGTH
NIKE: “JUST DO IT”
Nike, founded in 1964 by Bill Bowerman and Phil Knight, takes its name from Nike, the Greek Goddess of victory. The company manufactures sportswear and equipment, operates its own retail stores and employs more than 73 thousand people worldwide.
In addition to marketing hundreds of products under its own name, the company owns plethora of other well known brands, including but not limited to Air Jordan, Air Force 1, Air Max, Nike Skateboarding, Nike CR7, Converse and Hurley International.
Nike is synonymous with elite athletics as they sponsor hundreds of high-profile athletes and sports teams around the world.

image sources: google
In sum, NIKE’s moat is constituted of its scale (over $34 billion in annual sales), brand intangible asset (the company controls 50% of the American market and 19% of the Chinese market), key sponsorships and pricing power (through premium innovation).
ADIDAS: “IMPOSSIBLE IS NOTHING”
Adidas is a German company founded in 1924 by Adolf Dassler that designs and manufactures shoes, clothing and accessories. It is the largest sportswear company in Europe, employing over 57 thousand people and the second largest in the world, after Nike.
In addition to its namesake brand, the company also owns Reebok, 8.33% of the Bayern Munich football team, and Australian fitness technology company Runtastic. The company also operates its own stores, supplies millions of merchants worldwide, and sponsors top athletes and sports teams.

NBA star James harden signed a 13-year $200 million contract
source of images: google
In sum, ADIDAS’ moat is constituted by its deep branded portfolio, intangible assets (long history of product innovation) and key sponsorships (Adidas recently pried James Harden away from Nike).
VERDICT: While Adidas has a long history of innovation, boasts a portfolio of popular brands and has developed key sponsorships with some of the world’s top athletes, Nike’s economic moat is wider and the brand has more appeal.
WINNER: NIKE.
2 – REVENUES
NIKE
Despite being the undisputed market leader, Nike’s yearly sales are still growing at an impressive rate:
- 2019 Total Revenue is $39 billion, up 20.8% since 2016.
Since 2016, Revenues are increasing without dipping. - 2019 EBITDA is $5.49 billion, up 6.3% since 2016.
Since 2016, EBITDA is consistently above $5 billion.
Nike’s EBITDA represents 14% of Revenues. - 2019 Net Income is $4 billion, up 7% since 2016.
Since 2016, Net Income is consistently above $3.7 billion, but dipped below $3 billion in 2018.
Net Income represents 10% of Revenues.

ADIDAS
Adidas’ revenues are much lower than Nike’s but they are also growing at an impressive rate:
- 2019 Total Revenue is $23.6 billion, up 22.5% since 2016.
Since 2016, Revenues are increasing without dipping. - 2019 EBITDA is $3.93 billion, up 105% since 2016.
Since 2016, EBITDA is increasing without dipping.
EBITDA represents 16.6% or revenues - 2019 Net Income is $1.97 billion, up 94% since 2016.
Since 2016, Net Income is increasing without dipping.
Net Income represents 8.3% of Revenues.

VERDICT: Nike is the larger company but Adidas is growing at a faster pace.
WINNER: ADIDAS.
3 – MARGINS & PROFITABILITY
NIKE
Undeniably, Nike’s margins are robust:
- 5-year average annual Gross Margin is 45%.
This is slightly superior to the industry average of 44.69%. - 5-year average annual Net Profit Margin is 11.15%.
This is superior to the industry average of 9.86%.

(Note: The first column is the company’s ratios and the second column the industry average)
Evidently, Nike’s management is very competent at generating returns:
- 5-year average annual Return on Equity is 33.73%
This is significantly superior to the industry average of 23.43% - 5-year average annual Return on Assets is 17.53%
This is superior to the industry average of 14.79% - 5-year average annual Return on Investment is 24%.
This is significantly superior to the industry average of 19.84%

ADIDAS
Margins are also robust, although net margins are quite low:
- 5-year average annual Gross Margin is 49.71% (vs Nike’s 45%).
This is slightly superior to the industry average of 48.01%. - 5-year average annual Net Margin is 5.8% (vs Nike’s 11.15%).
This is slightly superior to the industry average of 4.13%.

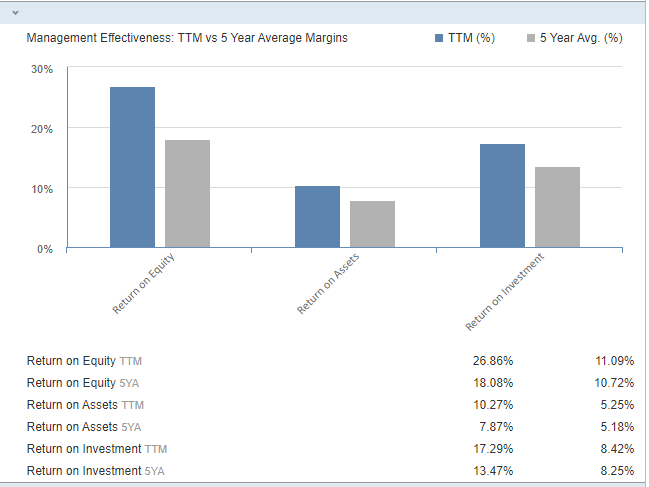
Adidas’ returns are good but significantly lower than Nike’s:
- 5-year average annual ROE is 18.08% (vs Nike’s 33.73%).
This is significantly superior to the industry average of 10.72%. - 5-year average annual ROA is 10.27% (vs Nike’s 17.53%).
This is superior to the industry average of 5.25%. - 5-year average annual ROI is 13.47% (vs Nike’s 24%).
This is significantly superior to the industry average of 8.25%.
VERDICT: Both companies are outperforming relative to their industry average. However, while Adidas’ gross margin is better than Nike’s, Nike’s net profit margin is much higher. Furthermore, Nike’s returns are significantly higher than Adidas’.
WINNER: NIKE.
4 – ASSETS & LIABILITIES
NIKE
Summary of Nike’s assets and liabilities:
- Since 2016: Total Liabilities increased 60.61%
- Since 2016: Total Assets increased 10.8%
- Since 2016: Total Stockholder Equity decreased 26%
- Since 2016: Long Term Debt increased 72%
- 2019 Current Ratio is 2.1 which is very good
- 2019 Debt to Equity Ratio is 1.62 which is poor
- 2091 Debt Ratio is 0.61 which is very good.
In sum: Nike’s financial situation is relatively strong. We do note a considerable increase in liabilities and a significant decrease in stockholder equity. Should investors be worried? Frankly, not so much: Nike’s is growing its revenues, sustaining high margins and generating profits. In fact, its 2019 EBITDA of $5.49 billion more than cover the $3.4 billion of long term debt. The company’s debt burden is sustainable.


ADIDAS
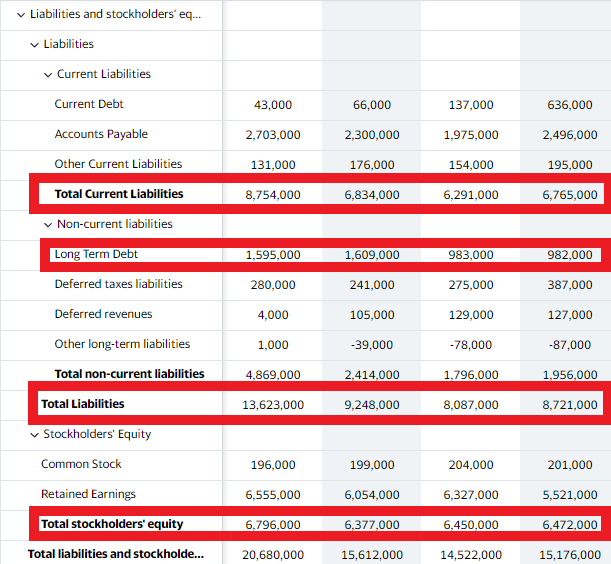
Summary of Adidas’ assets and liabilities:
- Since 2016: Total Assets increased 32.2%
- Since 2016: Total Liabilities increased 56.2%
- Since 2016: Total Stockholder Equity increased 5%
- Since 2016: Total Long Term Debt increased 62%
- 2019 Current Ratio is 1.24 which is decent
- 2019 Debt to Equity Ratio is 2.00 which is poor.
- 2019 Debt Ratio is 0.65 which is good.
In sum: Adidas’ financial situation is very strong. However, the long term debt increased 62% since 2016 and the company’s debt to equity ratio has increased to 2.00 from 1.34 in 2016. Nevertheless, the company’s total assets outweigh its liabilities. Further, the total long term debt of $1.5 billion is entirely covered by it 2019 EBITDA of $3.9 billion. The company’s debt burden is sustainable.

VERDICT: Both companies have sustainable debt levels. However, Nike’s stockholder equity has significantly decreased since 2016 whereas Adidas’ has increased.
WINNER: ADIDAS.
5 – CASH FLOW
NIKE
Nike’s Free Cash Flow is increasing at an impressive pace: Its 2019 FCF of $4.7 billion is up 144.9% since 2016.

ADIDAS
Adidas’ Free Cash Flow is also increasing very rapidly: Its 2019 FCF of $2.1 billion is up 202.8% since 2016.

VERDICT: Both companies are generating massive Free Cash Flow. While Nike’s total Free Cash Flow is higher in dollar amounts, Adidas’s Free Cash Flow is increasing at an much faster rate. However, “cash is king” and Nike generates twice the total cash flow Adidas does.
WINNER: NIKE.
6 – THE DIVIDEND
NIKE
Nike’s annual dividend payout is $0.98 per share and the payout ratio is 39.3%, which is reasonable.
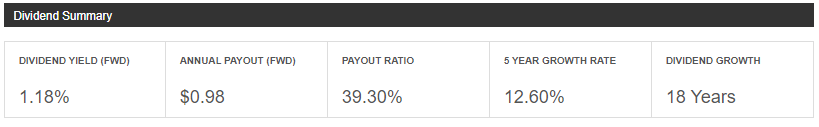
Nike’s dividend yield of 1.18% is low. Historically, the yield has always been very low and has not surpassed 1.5% in the past 10 years.

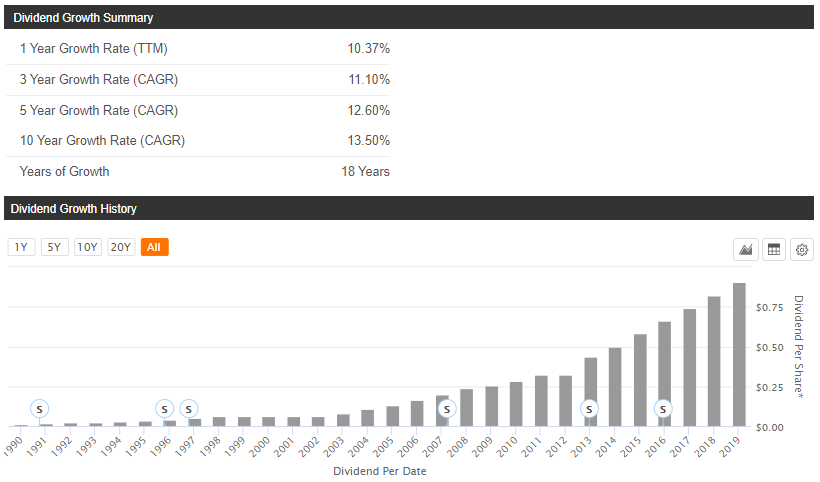
Despite proposing a low dividend yield, Nike has increased its dividend for 18 consecutive years. However, we do note an unfortunate deceleration of the dividend growth rate in recent years, with a 10-year growth rate of 13.5%, a 5-year growth rate of 12.6%, a 3-year growth rate of 11.1% and a 1-year growth rate of 10.3%. This is not good considering how low the yield is.
In sum: Nike’s dividend yield is low but the payout is reliable.
ADIDAS
Adidas’ annual dividend payout if $4.33 and the payout ratio is 38.6%.
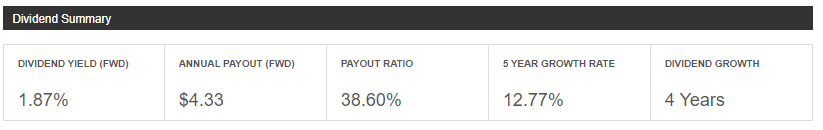
Adidas’ current dividend yield of 1.87% is higher than Nike’s. As a result of the recent dip in stock price, the current yield is higher than the 4-year average, indicating the stock price may be slightly undervalued.

Adidas dividend growth is strong. While the growth rate is erratic, with wild swings in dividend increases, it is consistently superior to Nike’s. However, there is a red flag: the dividend has been cut in the past at least twice since 2008 which means that the company is not really crisis proof. That being said, a temporary dividend cut is sometimes necessary to free up the extra cash needed to invest and ensure the business’ long term survival.

VERDICT: Both companies pay out relatively low-yield dividends. However, Adidas’ dividend yield and growth rate are higher but Nike has a more reliable history of consistent dividend growth. If Nike continues to grow the dividend, it can can reach dividend aristocrat status in less then 10 years.
WINNER: ADIDAS.
7 – STOCK PERFORMANCE
How have Nike and Adidas stock performed in the past? Although past performance does not guarantee similar future performance, it does provide some indication of what to expect.
NIKE
Nike’s stock price has increased 350% in 10 years, which represents an average annual growth rate of 35%. The stock reached its all time high of $104.58 on January 21st, 2020, before plunging 20.41% in February.
NIKE’s current P/E ratio is 30.80. This means that the stocks price is trading at 30 times earnings, which is considered high.

ADIDAS
Adidas’ stock price increased 415.5% in 10 years, which represents an average annual growth rate of 41.55%. The stock reached its all time high of $316.05 on January 15th, 2020, before plunging 33.8%.
ADIDAS’ current P/E ratio is 21.54. This means that the stock is currently trading at 21.5 times its earnings, which is reasonable.

VERDICT: Over the past 10 years, both stocks have performed strongly. However, ADIDAS’ stock has generated greater capital gains returns and trades at a lower P/E ratio.
WINNER: ADIDAS.
CONCLUSION
Both companies are exceptionally well managed and extremely profitable. Nike is much larger but Adidas is growing at a faster rate. Both companies have solid balance sheets but Adidas appears in [very] slightly better financial shape. However, Nike has much higher margins and generates greater cash flow. Concerning the dividend, Adidas has the slightly higher yield and dividend growth rate but Nike has raised its dividend for the past 18 consecutive years compared to Adidas’ 4. Lastly, Adidas’ stock has generated greater capital gains over the past 10 years but is listed on the Frankfurt Stock Exchange whereas Nike stock has the advantage of being listed on the US market.
Here’s the recap of who won each round:
- Franchise strength: NIKE
- Revenues: ADIDAS
- Margins and profitability: NIKE
- Assets and liabilities: ADIDAS
- Cash flow: NIKE
- Dividend: ADIDAS
- Stock performance: ADIDAS
- WINNER: ADIDAS.
My analysis reveals that ADIDAS is the slightly better investment due to its strong growth, well controlled liabilities and a better dividend payout.
However, both companies are solid long-term investments and your choice to invest in one or the other will depend on your personal brand preference and the criteria you favor when choosing a stock.
Enjoyed this article? Like and follow me.
Leave a comment below to continue the conversation.
Disclaimer: This is not financial advice. Do you own research before investing in any asset.
